Fig. 2
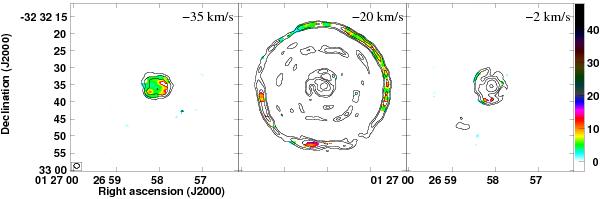
Intensity ratio, I12CO/I13CO, (color) and 12CO(J = 3 → 2) flux (contours) for three different velocity channels (the full channel range is presented in Fig. C.1). The channels are averaged over three km s-1 and the panels are are labeled according to their VLSR. The ratio is presented where 13CO emission is detected at higher than three σ (where σ = 15 mJy beam-1) and the color scale runs from 0 to 42. The 12CO contour levels are drawn at 6,12,24,48 and 96σ, with σ = 25 mJy beam-1. Where no 13CO is detected, the contours are equivalent to a 1σ lower limit to the 12CO/13CO intensity ratio of 10,20,40,80, and 160, respectively. The beam size is indicated in the left panel.
Current usage metrics show cumulative count of Article Views (full-text article views including HTML views, PDF and ePub downloads, according to the available data) and Abstracts Views on Vision4Press platform.
Data correspond to usage on the plateform after 2015. The current usage metrics is available 48-96 hours after online publication and is updated daily on week days.
Initial download of the metrics may take a while.