Free Access
Fig. 1
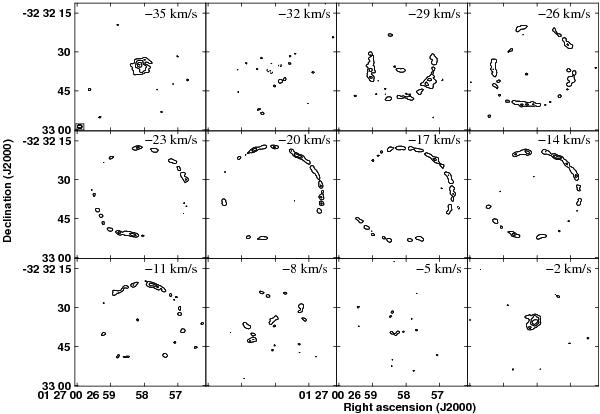
13CO(J = 3 → 2) intensity contours. The channels are averaged over three km s-1. The panels are labeled with their VLSR and the beam is indicated in the top left panel. The 13CO contour levels are drawn at −4σ (dashed) and 4,8,12, and 16σ, with σ = 15 mJy beam-1.
Current usage metrics show cumulative count of Article Views (full-text article views including HTML views, PDF and ePub downloads, according to the available data) and Abstracts Views on Vision4Press platform.
Data correspond to usage on the plateform after 2015. The current usage metrics is available 48-96 hours after online publication and is updated daily on week days.
Initial download of the metrics may take a while.