Fig. 5
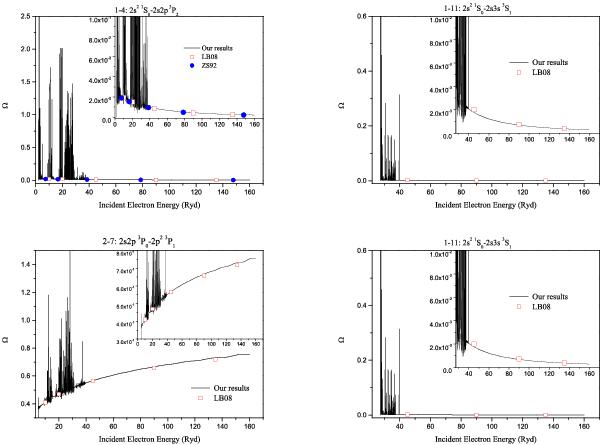
Collision strengths for the optically allowed transitions 1–13 and 2–7, optically forbidden transition 1–4, and the intercombination transition 1–11: solid curve – our DARC calculation, open red square – DW calculations from Landi & Bhatia (2008), solid blue circle – calculations from Zhang & Sampson (1992). The insets show the details of the collision strengths near the background.
Current usage metrics show cumulative count of Article Views (full-text article views including HTML views, PDF and ePub downloads, according to the available data) and Abstracts Views on Vision4Press platform.
Data correspond to usage on the plateform after 2015. The current usage metrics is available 48-96 hours after online publication and is updated daily on week days.
Initial download of the metrics may take a while.