Fig. 4
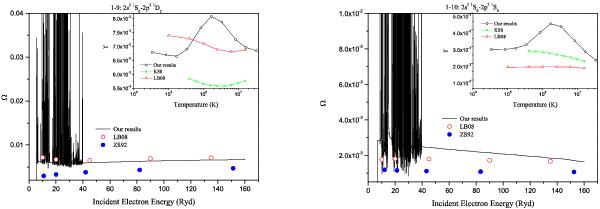
Collision strength 1–9 and 1–10: solid black curve – our DARC results, solid blue circle – DW calculation of Zhang & Sampson (1992), open red circle – DW calculation of Landi & Bhatia (2008). The insets in the graphs compare the corresponding effective collision strength (Υ) as a function of the electron temperature: open black circle – our DARC results, open star – R-matrix interpolated work of Keenan (1988), open upward triangle – DW calculations from Landi & Bhatia (2008).
Current usage metrics show cumulative count of Article Views (full-text article views including HTML views, PDF and ePub downloads, according to the available data) and Abstracts Views on Vision4Press platform.
Data correspond to usage on the plateform after 2015. The current usage metrics is available 48-96 hours after online publication and is updated daily on week days.
Initial download of the metrics may take a while.