Free Access
Fig. 1
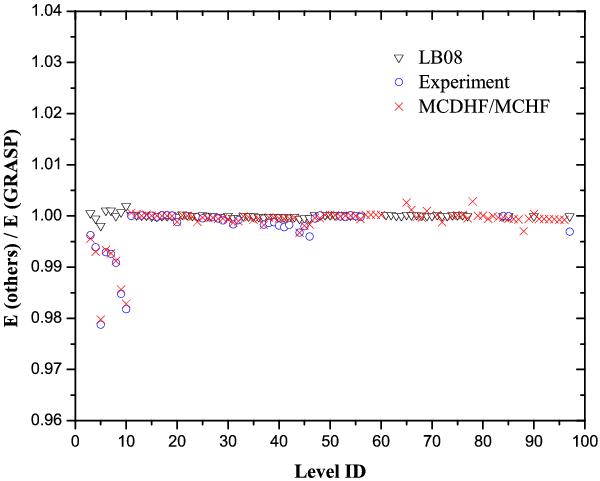
Ratio between our level energies and previous calculations: black triangle – DW calculations of Landi & Bhatia (2008), blue circle – experimental values, red cross – both the NIST’s MCDHF compilations and MCHF results from Mania et al. (2009).
Current usage metrics show cumulative count of Article Views (full-text article views including HTML views, PDF and ePub downloads, according to the available data) and Abstracts Views on Vision4Press platform.
Data correspond to usage on the plateform after 2015. The current usage metrics is available 48-96 hours after online publication and is updated daily on week days.
Initial download of the metrics may take a while.