Free Access
Fig. 5
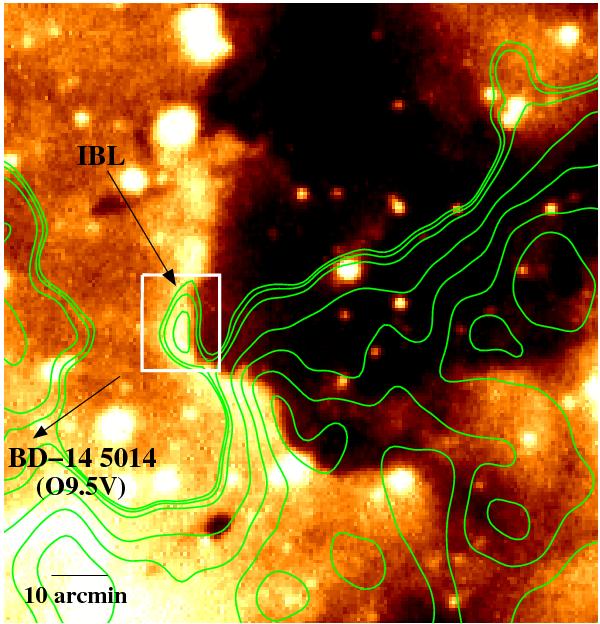
Hα image of the BRC. The green contours represent the radio continuum emission at 5 GHz. Contours levels are at 0.7 (about 4σ above the rms noise level), 0.9, 1, 2, 3, 4, and 5 × 10⁻⁴ Jy/beam. The white box indicates the IBL region associated with the protrusion A.
Current usage metrics show cumulative count of Article Views (full-text article views including HTML views, PDF and ePub downloads, according to the available data) and Abstracts Views on Vision4Press platform.
Data correspond to usage on the plateform after 2015. The current usage metrics is available 48-96 hours after online publication and is updated daily on week days.
Initial download of the metrics may take a while.