Fig. 4
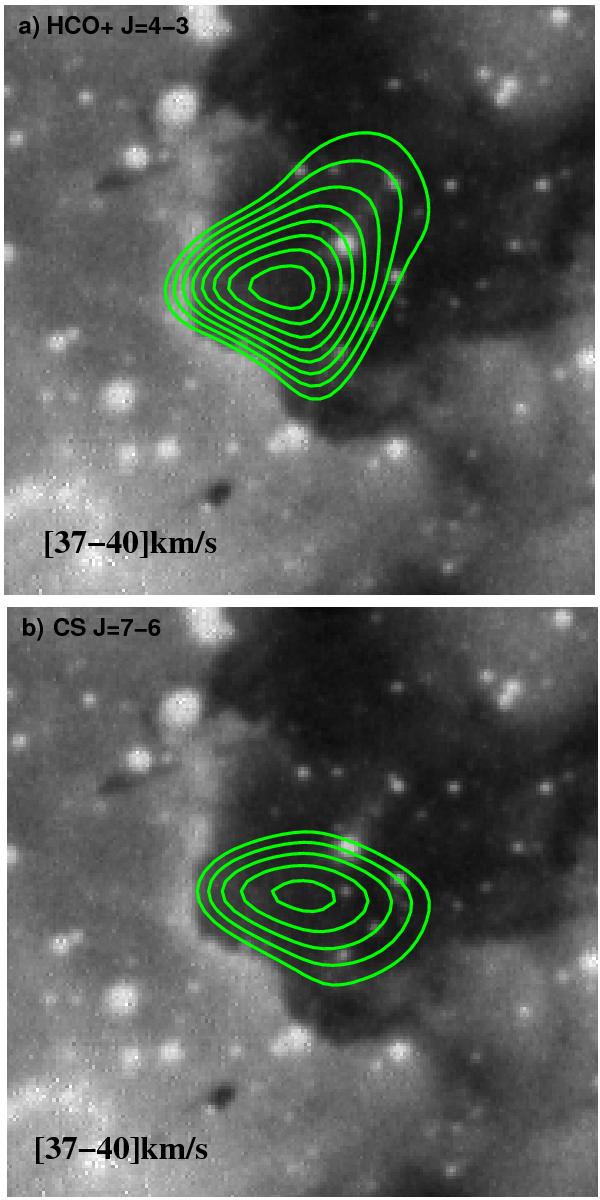
a) Emission distribution of the HCO+J = 4−3 transition integrated between 37 and 40 km s-1 (green contours) superimposed onto the Hα emission of the BRC. Contours levels go from 0.8 to 2.2 K km s-1 in steps of 0.2 K kms-1. b) Emission distribution of the CS J = 7−6 transition integrated between 37 and 40 km s-1 (green contours) superimposed onto the Hα emission of the BRC. Contours levels are at 0.3, 0.4, 0.5, 0.6, and 0.7 K km s-1.
Current usage metrics show cumulative count of Article Views (full-text article views including HTML views, PDF and ePub downloads, according to the available data) and Abstracts Views on Vision4Press platform.
Data correspond to usage on the plateform after 2015. The current usage metrics is available 48-96 hours after online publication and is updated daily on week days.
Initial download of the metrics may take a while.