Fig. 2
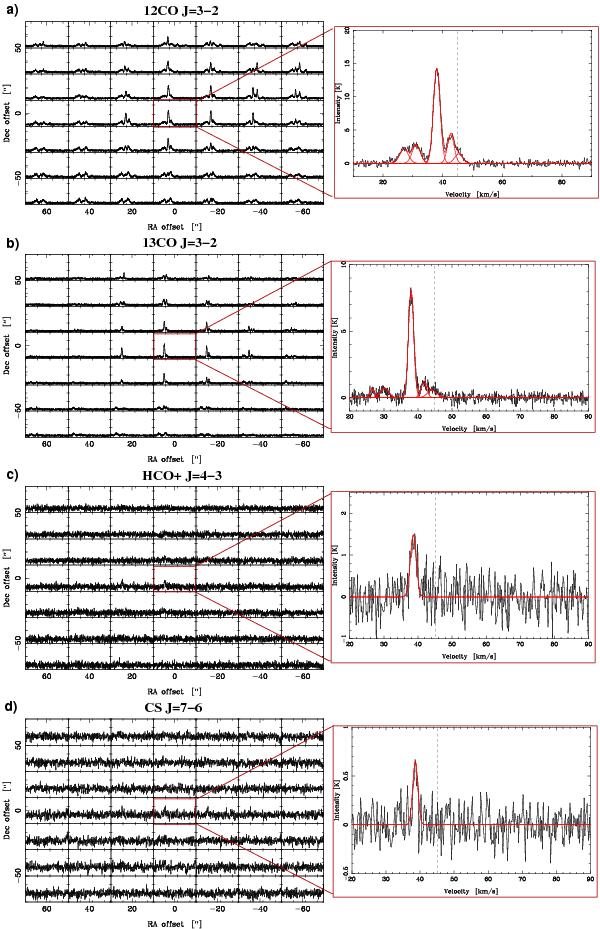
Left column: 12CO J = 3−2 a); 13CO J = 3−2 b); HCO+J = 4−3 c); and CS J = 7−6 d) spectra obtained towards the 2′ × 2′ region (white box in Fig. 1) mapped with ASTE. Right column: spectra towards the position (0, 0) of the four transitions smoothed to a velocity resolution of 0.22 km s-1. The single or multiple-component Gaussian fits are shown in red. The dashed line marks the systemic velocity of the molecular cloud. All velocities are in Local Standard of Rest.
Current usage metrics show cumulative count of Article Views (full-text article views including HTML views, PDF and ePub downloads, according to the available data) and Abstracts Views on Vision4Press platform.
Data correspond to usage on the plateform after 2015. The current usage metrics is available 48-96 hours after online publication and is updated daily on week days.
Initial download of the metrics may take a while.