Fig. 2
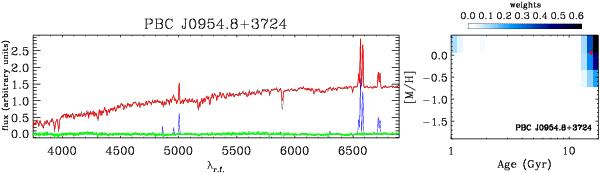
Left panel: the galaxy spectrum (black line) is compared to the fitted linear combination of template stellar spectra (red line) and emission lines (blue line). The green dots show the residuals. Right panel: age and metallicity obtained from the spectral fitting. The color scale refers to the mass fraction in each bin of age and metallicity. The red dot represents the mass-weighted age ⟨ t / Gyr ⟩ M and the mass-weighted metallicity ⟨[M/H]⟩ M.
Current usage metrics show cumulative count of Article Views (full-text article views including HTML views, PDF and ePub downloads, according to the available data) and Abstracts Views on Vision4Press platform.
Data correspond to usage on the plateform after 2015. The current usage metrics is available 48-96 hours after online publication and is updated daily on week days.
Initial download of the metrics may take a while.