Fig. 9
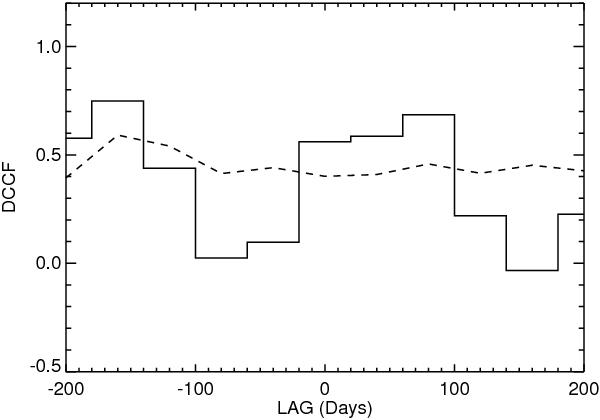
Solid curve: Discrete Cross Correlation Function comparing the available Abastumani R-band optical data points and the 28-day Fermi-LAT γ-ray flux values as a function of the lag between the optical and γ-ray data. Positive lag indicates that the γ rays lead the optical. Dashed curve: DCCF for a calculated correlation probability of 90%.
Current usage metrics show cumulative count of Article Views (full-text article views including HTML views, PDF and ePub downloads, according to the available data) and Abstracts Views on Vision4Press platform.
Data correspond to usage on the plateform after 2015. The current usage metrics is available 48-96 hours after online publication and is updated daily on week days.
Initial download of the metrics may take a while.