Fig. 6
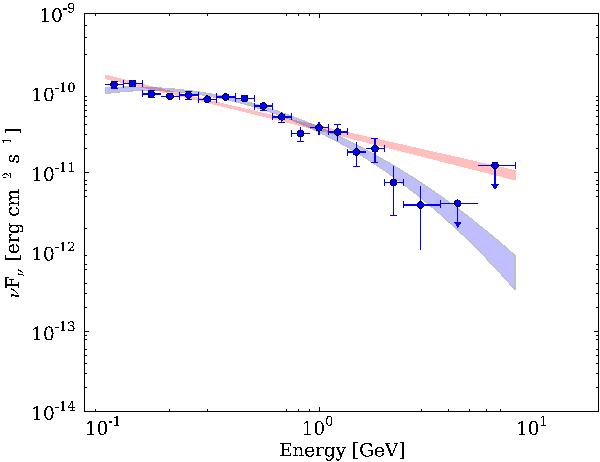
Energy spectrum of 0836+710 during the flare (see Figs. 1 or 2). The red shaded region is the likelihood power-law fit to the entire energy range, showing the statistical uncertainty. The blue shaded region is the likelihood log-parabola fit to the entire energy range, showing the statistical uncertainty. The reference, or pivot, energy for each of the shaded regions is 0.32 GeV.
Current usage metrics show cumulative count of Article Views (full-text article views including HTML views, PDF and ePub downloads, according to the available data) and Abstracts Views on Vision4Press platform.
Data correspond to usage on the plateform after 2015. The current usage metrics is available 48-96 hours after online publication and is updated daily on week days.
Initial download of the metrics may take a while.