Free Access
Fig. 10
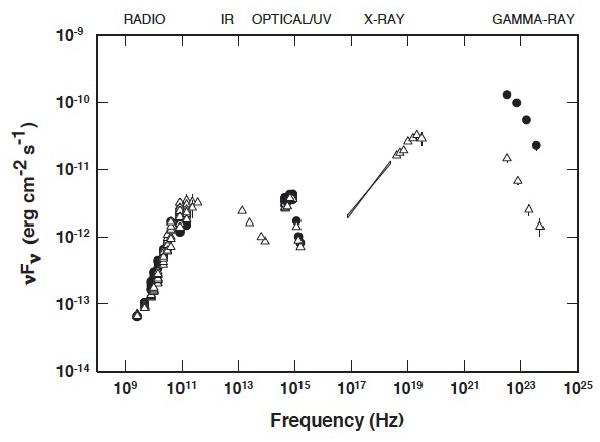
The 0836+710 SED shows contemporaneous data for the quiescent (open symbols) and active (filled symbols) periods. For the LAT data, the filled symbols show the spectrum during the flare, 2011 October 25 (MJD 55 859) to 2011 December 25 (MJD 55 920).
Current usage metrics show cumulative count of Article Views (full-text article views including HTML views, PDF and ePub downloads, according to the available data) and Abstracts Views on Vision4Press platform.
Data correspond to usage on the plateform after 2015. The current usage metrics is available 48-96 hours after online publication and is updated daily on week days.
Initial download of the metrics may take a while.