Fig. 5
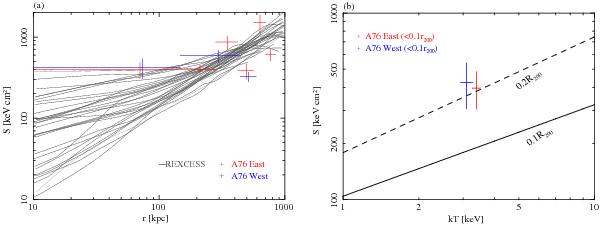
a) Comparison of radial entropy profiles between A76 and the REXCESS sample (gray lines; Pratt et al. 2010). b) Correlation between entropy and temperature. The red and blue crosses show the Suzaku results for A76 East and West data, respectively, while the solid and dashed lines show the S − T relationships of 10 morphologically relaxed clusters at 0.1r200 and 0.2r200 (Pratt et al. 2006).
Current usage metrics show cumulative count of Article Views (full-text article views including HTML views, PDF and ePub downloads, according to the available data) and Abstracts Views on Vision4Press platform.
Data correspond to usage on the plateform after 2015. The current usage metrics is available 48-96 hours after online publication and is updated daily on week days.
Initial download of the metrics may take a while.