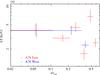
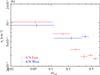
Fig. 4
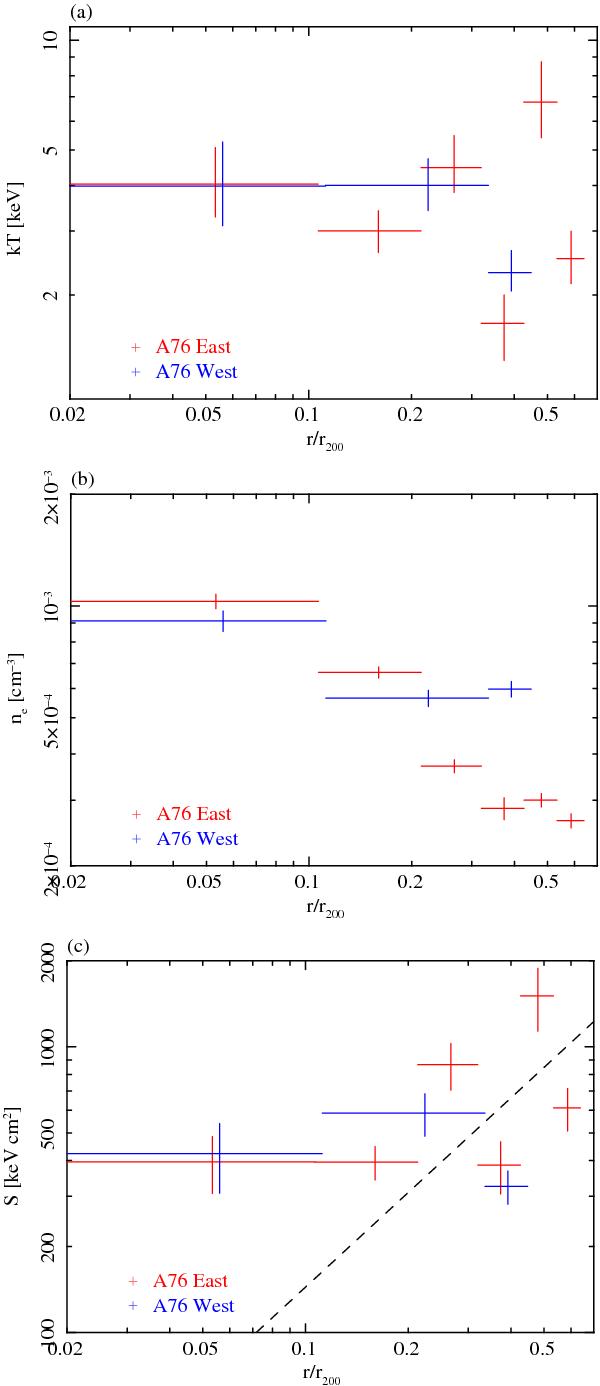
a) Temperature; b) electron density; and c) entropy profiles derived from the deprojection analysis. The results for A76 East and West data are shown as red and blue crosses (the markers for A76 West are shifted horizontally by 5% for clarity). In panel c), the dashed line represents the baseline entropy profile, S ∝ r1.1 (Voit et al. 2005).
Current usage metrics show cumulative count of Article Views (full-text article views including HTML views, PDF and ePub downloads, according to the available data) and Abstracts Views on Vision4Press platform.
Data correspond to usage on the plateform after 2015. The current usage metrics is available 48-96 hours after online publication and is updated daily on week days.
Initial download of the metrics may take a while.