Fig. 1
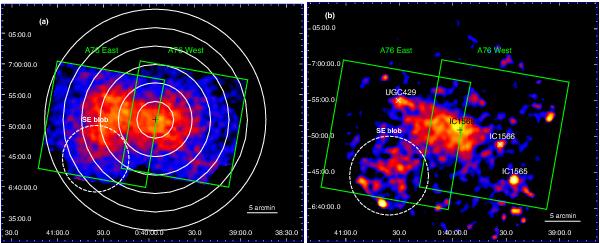
a)Suzaku XIS-1 mosaic image of A76 in the 0.5–5 keV band. The image is corrected for exposure map and vignetting effect and is smoothed by a Gaussian function with σ = 40″, without background subtraction. The location of the X-ray peak corresponding to member galaxy IC 1568 is marked with the plus sign. The spectral integration regions used in Sects. 3.1 and 3.2 lie within the green boxes and white circles, respectively. The two corners of the CCD chip illuminated by 55Fe calibration sources are excluded from the image. b) XMM-Newton PN image of A76 in the 0.5–2 keV band with subtracted background and σ = 20″ Gaussian smoothing. The net exposure time is approximately 600 s. The positions of three detected sources (Sect. 2) and the SE blob (Sect. 4) are indicated by crosses and a dashed circle, respectively.
Current usage metrics show cumulative count of Article Views (full-text article views including HTML views, PDF and ePub downloads, according to the available data) and Abstracts Views on Vision4Press platform.
Data correspond to usage on the plateform after 2015. The current usage metrics is available 48-96 hours after online publication and is updated daily on week days.
Initial download of the metrics may take a while.