Free Access
Fig. 6
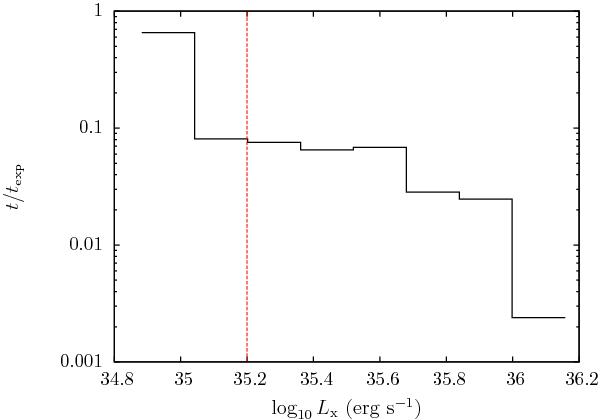
Histogram of probability distribution of luminosity of IGR J17354–3255, observed with XRT. The vertical dashed line corresponds to the luminosity threshold below which the probability distribution of luminosity is not well reproduced due to the sensitivity of XRT.
Current usage metrics show cumulative count of Article Views (full-text article views including HTML views, PDF and ePub downloads, according to the available data) and Abstracts Views on Vision4Press platform.
Data correspond to usage on the plateform after 2015. The current usage metrics is available 48-96 hours after online publication and is updated daily on week days.
Initial download of the metrics may take a while.