Fig. 3
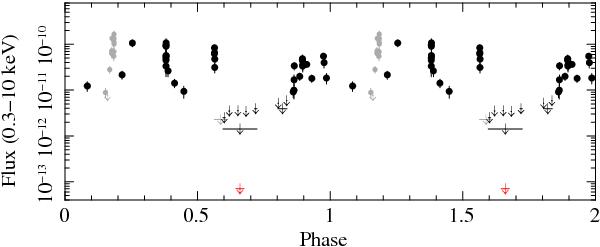
Swift/XRT 0.3–10 keV flux light curve of IGR J17354–3255, folded at Porb = 8.4474 d and Tepoch = MJD 52 698.205 (Sguera et al. 2011). Downward-pointing arrows are 3σ upper limits. The data collected in 2012 are shown in black, the 2008 and 2009 data in grey. The large black downward-pointing arrow at phase 0.66 is obtained by combining five observations (00032513017 through 00032513021) for a total on-source exposure of 5.9 ks. The black downward-pointing arrow at phase 0.82 is obtained by combining two observations (00032513001–2) for a total on-source exposure of 2.0 ks. The red arrow at ~7 × 10-14 erg cm-2 s-1, also at phase 0.66, is the 3-σ upper limit obtained from a 19 ks exposure on 2011 March 6 with XMM-Newton (Bozzo et al. 2012).
Current usage metrics show cumulative count of Article Views (full-text article views including HTML views, PDF and ePub downloads, according to the available data) and Abstracts Views on Vision4Press platform.
Data correspond to usage on the plateform after 2015. The current usage metrics is available 48-96 hours after online publication and is updated daily on week days.
Initial download of the metrics may take a while.