Fig. 1
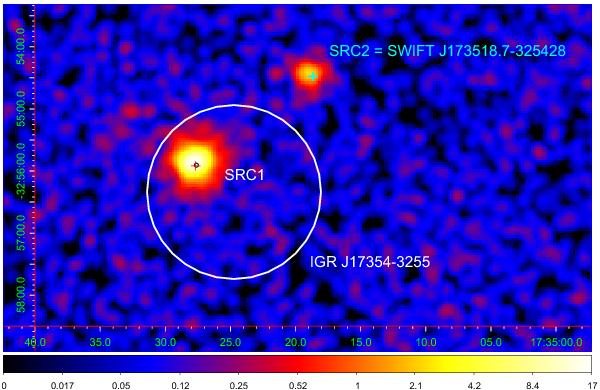
Region around IGR J17354–3255, as observed by Swift/XRT (0.3–10 keV). All data collected by XRT were used. The large circle is the INTEGRAL 90% error box (1.4′, Bird et al. 2010). The crosses mark the two XRT sources in the field of IGR J17354–3255 (src1 within the INTEGRAL error circle, src2 outside of it). The black circle represents the position of the 2MASS counterpart of IGR J17354–3255.
Current usage metrics show cumulative count of Article Views (full-text article views including HTML views, PDF and ePub downloads, according to the available data) and Abstracts Views on Vision4Press platform.
Data correspond to usage on the plateform after 2015. The current usage metrics is available 48-96 hours after online publication and is updated daily on week days.
Initial download of the metrics may take a while.