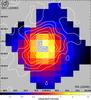
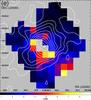
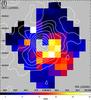
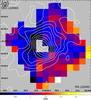
Fig. 6
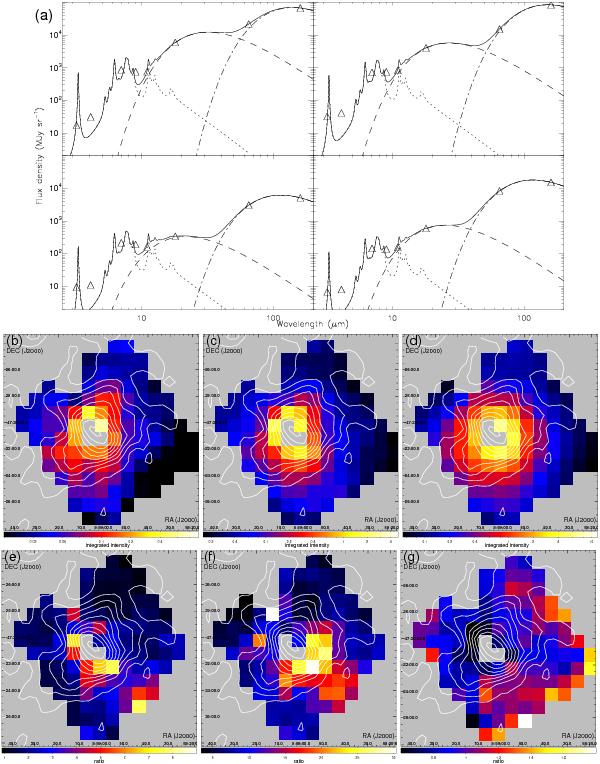
a) Examples of SEDs fitted by a PAH plus double-temperature dust model. Distributions of b) PAH, c) warm dust, and d) cool dust emission, decomposed by the SED fitting. The color levels correspond to the 2.5–1000 μm intensities given in units of erg s-1 cm-2 sr-1. e) Ratios of the warm dust to the PAH and f) the cool dust to the PAH component; the area with PAH intensity levels lower than 0.008 erg s-1 cm-2 sr-1 are masked in calculating the ratios. g) Ratio of the observed 3 μm band intensity to the model-predicted 3 μm intensity. The superposed contours are the distribution of the [CII] emission, the same as in Fig. 1.
Current usage metrics show cumulative count of Article Views (full-text article views including HTML views, PDF and ePub downloads, according to the available data) and Abstracts Views on Vision4Press platform.
Data correspond to usage on the plateform after 2015. The current usage metrics is available 48-96 hours after online publication and is updated daily on week days.
Initial download of the metrics may take a while.