Fig. 5
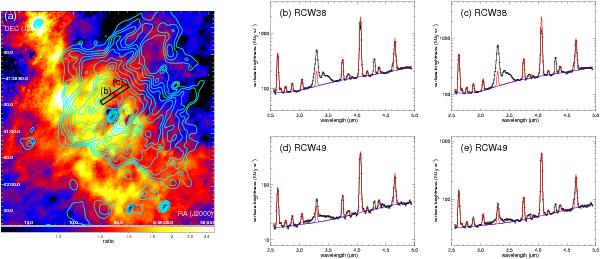
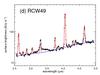
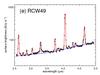
a) Contour map in the AKARI 3 μm band with logarithmically spaced 13 levels from 30 to 700 MJy sr-1, overlaid on the 4 μm to 3 μm ratio map, the same as in Fig. 7a but a close-up image of the central region. The rectangles indicate the sub-slit apertures used to create the spectra in panels b and c. The AKARI 2.5–5 μm spectra of the central regions of RCW 38 b), c), compared with those of the central regions of RCW 49 d), e). We note that the Brα line at 4.05 μm is saturated in panels b) and c). The red solid curve in each spectrum shows the hydrogen recombination lines estimated by the case B model calculation plus the continuum approximated by multiple blackbody components (see text for details).
Current usage metrics show cumulative count of Article Views (full-text article views including HTML views, PDF and ePub downloads, according to the available data) and Abstracts Views on Vision4Press platform.
Data correspond to usage on the plateform after 2015. The current usage metrics is available 48-96 hours after online publication and is updated daily on week days.
Initial download of the metrics may take a while.