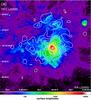
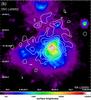
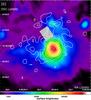
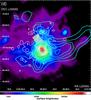
Fig. 2
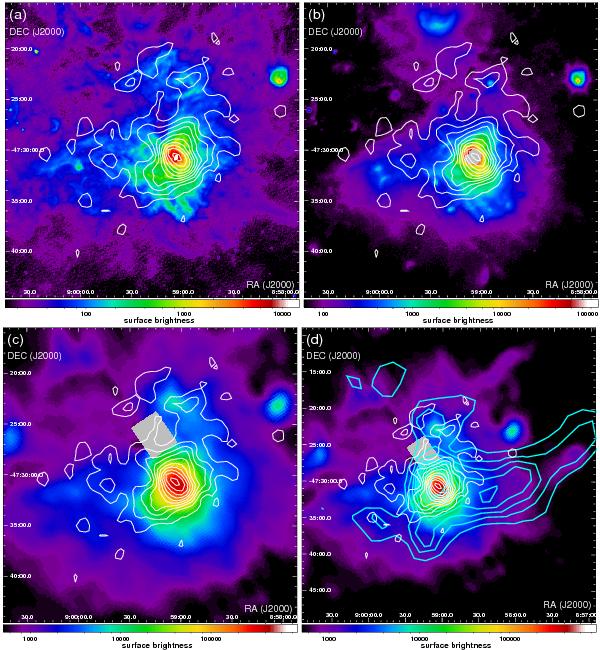
a) AKARI S9W (9 μm), b) L18W (18 μm), c) N160 (160 μm) band maps of RCW38, shown together with the [CII] contour map in Fig. 1. The color levels are given in units of MJy sr-1. The AKARI maps are derived from the all-sky survey data. d) Same as panel c), but enlarged and compared with the NANTEN 12CO J = 1–0 contours (velocity range: − 3–+ 12 km s-1), where the contour levels are linearly drawn from 30 to 100 K km s-1 in 10 steps.
Current usage metrics show cumulative count of Article Views (full-text article views including HTML views, PDF and ePub downloads, according to the available data) and Abstracts Views on Vision4Press platform.
Data correspond to usage on the plateform after 2015. The current usage metrics is available 48-96 hours after online publication and is updated daily on week days.
Initial download of the metrics may take a while.