Fig. 8
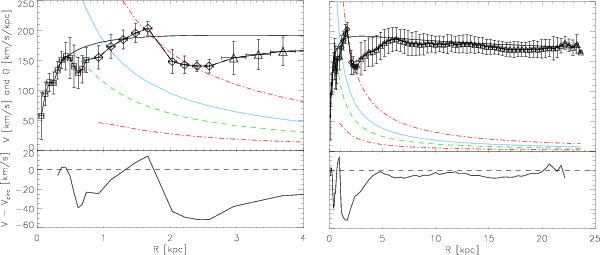
Gas rotation curve of NGC 5248, spanning the inner 4 kpc (left) and the entire disk out to 24 kpc (right). The rotation curve is based on our CO(2−1) (squares), as well as BIMA SONG CO(1−0) (diamonds) and VLA HI (triangles) data, giving both high spatial resolution and large radial coverage. A circular velocity curve is fit using Eq. (1), solid line. Frequency curves of Ω (solid, blue), Ω + κ/2, Ω − κ/2 (both dash-dot, red) and Ω − κ/4 (dashed, green) are also presented. The bottom panels show the difference between circular velocity model curve and ROTCUR derived rotation curve. (See text for further details.)
Current usage metrics show cumulative count of Article Views (full-text article views including HTML views, PDF and ePub downloads, according to the available data) and Abstracts Views on Vision4Press platform.
Data correspond to usage on the plateform after 2015. The current usage metrics is available 48-96 hours after online publication and is updated daily on week days.
Initial download of the metrics may take a while.