Fig. 7
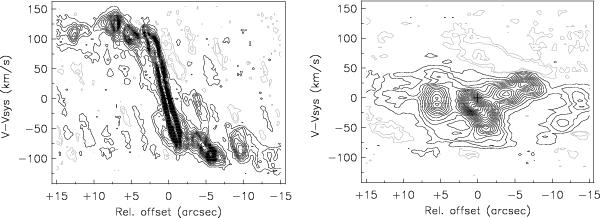
Left: position-velocity diagram along the major axis (PA of 115°) through the dynamic center. The cut was made from the SE (positive offsets) to the NW (negative offsets). Right: position-velocity diagram along the minor axis (PA of 25°) through the dynamic center, from the NE (positive offsets) to the SW (negative offsets). In both panels, the contours are at 2σ, in 2σ steps. The dynamic center is at (0, 0).
Current usage metrics show cumulative count of Article Views (full-text article views including HTML views, PDF and ePub downloads, according to the available data) and Abstracts Views on Vision4Press platform.
Data correspond to usage on the plateform after 2015. The current usage metrics is available 48-96 hours after online publication and is updated daily on week days.
Initial download of the metrics may take a while.