Fig. 6
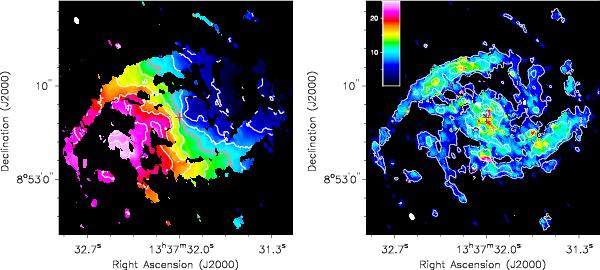
Left: first moment map of the CO(2−1) emission. Contours: −150 to 150 km s-1 with 25 km s-1 steps, 0 km s-1 thick gray contour. Velocities are relative to the systemic velocity, 1153 km s-1, with negative velocities in blue and positive velocities in red. Right: second moment map of the CO(2−1) emission. The color bar shows the dispersion in km s-1. Contours are the integrated CO(2−1) emission in 10σ steps starting at 5σ (1σ = 0.014 Jy beam-1 km s-1). The dynamic center is given with a red cross in both panels. A color version of this figure is available in the electronic version.
Current usage metrics show cumulative count of Article Views (full-text article views including HTML views, PDF and ePub downloads, according to the available data) and Abstracts Views on Vision4Press platform.
Data correspond to usage on the plateform after 2015. The current usage metrics is available 48-96 hours after online publication and is updated daily on week days.
Initial download of the metrics may take a while.