Fig. 4
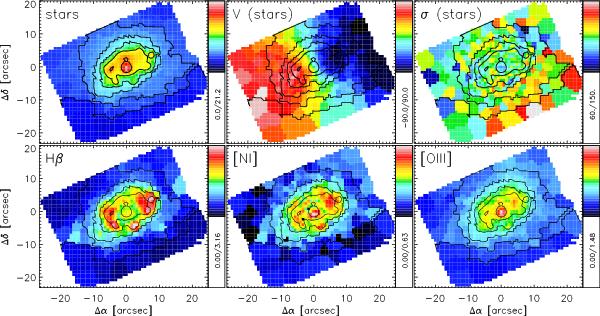
Top: SAURON maps of the stellar continuum, velocity field and velocity dispersion. Bottom: intensity distributions of the emission lines in the SAURON spectral range; Hβ, [NI] and [OIII]. The maps are oriented with north pointing up, and east to the left. The contours indicate the stellar flux in all panels and are included to guide the eye. A color version of this figure is available in the electronic version.
Current usage metrics show cumulative count of Article Views (full-text article views including HTML views, PDF and ePub downloads, according to the available data) and Abstracts Views on Vision4Press platform.
Data correspond to usage on the plateform after 2015. The current usage metrics is available 48-96 hours after online publication and is updated daily on week days.
Initial download of the metrics may take a while.