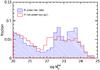
Fig. 6
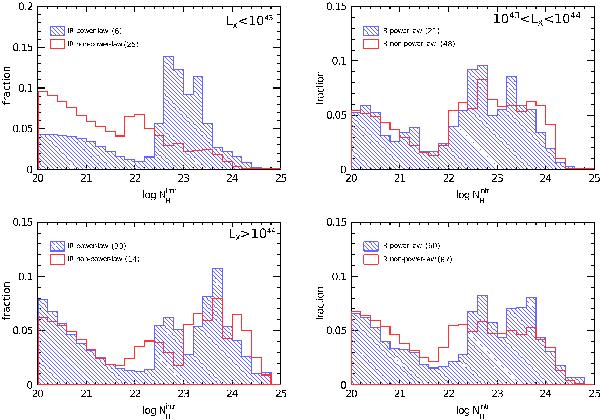
Normalised distribution of intrinsic absorbing column densities (in log units)
in three absorption corrected 2–10 keV luminosity bins (upper panels
and lower left panel) and for the entire sample
(lower right panel). The distributions were computed using
the probability density function for  of each individual source (see
Sect. 5, for details).
of each individual source (see
Sect. 5, for details).
Current usage metrics show cumulative count of Article Views (full-text article views including HTML views, PDF and ePub downloads, according to the available data) and Abstracts Views on Vision4Press platform.
Data correspond to usage on the plateform after 2015. The current usage metrics is available 48-96 hours after online publication and is updated daily on week days.
Initial download of the metrics may take a while.