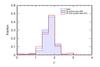
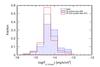
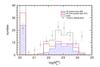
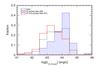
Fig. 4

Top panels: normalised distribution of the X-ray power-law
photon index and the observed 2–10 keV flux. Bottom panels:
normalised distribution of the intrinsic absorption and the rest-frame 2–10 keV
luminosity corrected for both Galactic and intrinsic absorption. The error
points in the intrinsic absorption distribution show the
 distribution for the sample
given by Tozzi et al. (2006). Solid-line
shaded and empty histograms show the distribution for the IR power-law and IR no
power-law populations, respectively. The dashed-line empty histogram shows the
distribution for the entire sample. All the values are given by the best fitted
model (see Sect. 3).
distribution for the sample
given by Tozzi et al. (2006). Solid-line
shaded and empty histograms show the distribution for the IR power-law and IR no
power-law populations, respectively. The dashed-line empty histogram shows the
distribution for the entire sample. All the values are given by the best fitted
model (see Sect. 3).
Current usage metrics show cumulative count of Article Views (full-text article views including HTML views, PDF and ePub downloads, according to the available data) and Abstracts Views on Vision4Press platform.
Data correspond to usage on the plateform after 2015. The current usage metrics is available 48-96 hours after online publication and is updated daily on week days.
Initial download of the metrics may take a while.