Fig. 2
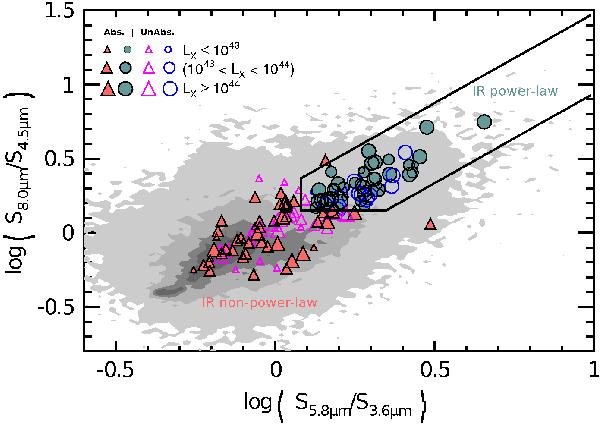
IRAC colour–colour diagram for the entire IRAC sample (plotted as a surface grey map) and for the cross-correlation sample: blue circles and red triangles represent IR power-law and IR non-power-law galaxies according to Donley et al. (2012), respectively. The filled and empty symbols denote absorbed and unabsorbed sources, respectively. The symbols change in size to denote different ranges of X-ray luminosity. The solid line shows the revised IRAC-criteria wedge by Donley et al. (2012).
Current usage metrics show cumulative count of Article Views (full-text article views including HTML views, PDF and ePub downloads, according to the available data) and Abstracts Views on Vision4Press platform.
Data correspond to usage on the plateform after 2015. The current usage metrics is available 48-96 hours after online publication and is updated daily on week days.
Initial download of the metrics may take a while.