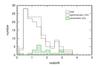
Fig. 1
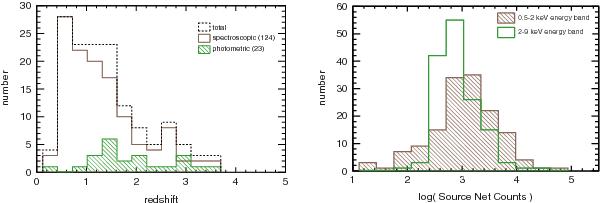
Left: spectroscopic and photometric redshift distribution as solid-line and hatched histograms, respectively. The dashed-line histogram represents the distribution of the redshift, regardless of whether it is photometric or spectroscopic. Right: source net count distribution for both the 0.5–2 keV and 2–9 keV energy bands as hatched and empty histograms, respectively.
Current usage metrics show cumulative count of Article Views (full-text article views including HTML views, PDF and ePub downloads, according to the available data) and Abstracts Views on Vision4Press platform.
Data correspond to usage on the plateform after 2015. The current usage metrics is available 48-96 hours after online publication and is updated daily on week days.
Initial download of the metrics may take a while.