Fig. 5
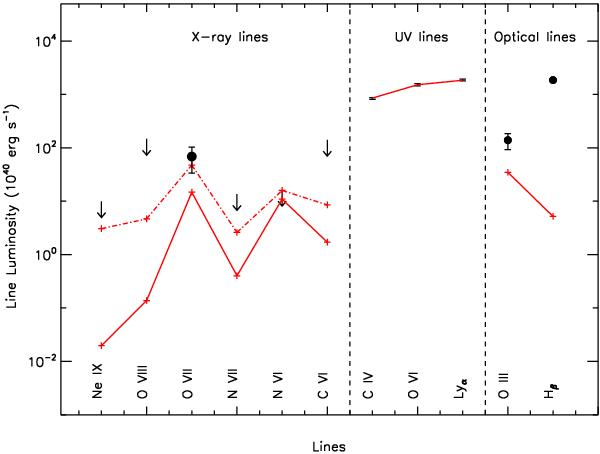
Best fit of the intrinsic luminosities of the UV narrow emission lines (middle panel). The model is displayed by a solid line only to guide the eye. The line luminosities predicted by the model in the X-ray (left panel) and in the optical (right panel) band are displayed by red crosses connected by a solid line. The model agrees with the upper limits for the X-ray lines but does not fit the optical lines. The qualitative best fit model for the X-ray lines is also shown by red crosses connected by a dot dashed line. Error bars, when larger than the size of the plotting symbols, are also shown. Note that a 3σ error bar is shown for O vii-f line.
Current usage metrics show cumulative count of Article Views (full-text article views including HTML views, PDF and ePub downloads, according to the available data) and Abstracts Views on Vision4Press platform.
Data correspond to usage on the plateform after 2015. The current usage metrics is available 48-96 hours after online publication and is updated daily on week days.
Initial download of the metrics may take a while.