Free Access
Fig. 3
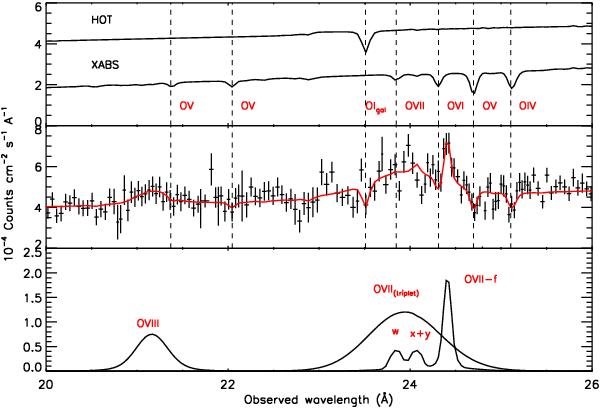
Middle panel: best fit to the RGS spectrum of 1H0419-577 in the 20−26 Å wavelength range. Upper panel: absorbing components. The neutral absorbers at z = 0 and the local WA (shifted downward for plotting purpose) are displayed as solid lines. Lower panel: profiles of the broad and narrow emission features.
Current usage metrics show cumulative count of Article Views (full-text article views including HTML views, PDF and ePub downloads, according to the available data) and Abstracts Views on Vision4Press platform.
Data correspond to usage on the plateform after 2015. The current usage metrics is available 48-96 hours after online publication and is updated daily on week days.
Initial download of the metrics may take a while.