Fig. 3
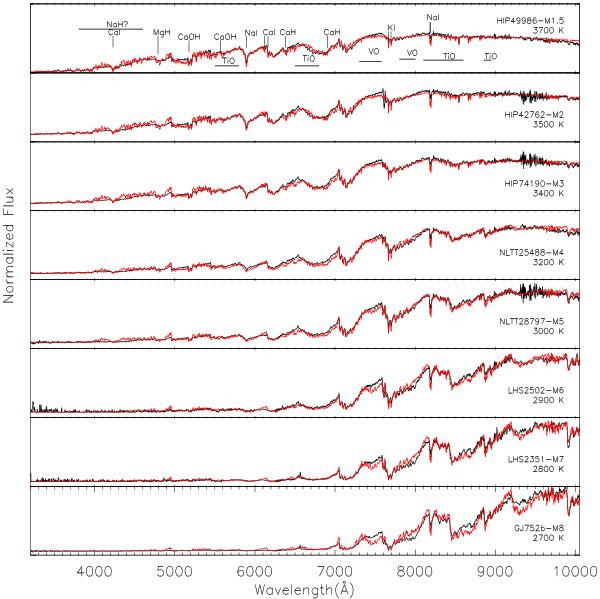
Optical to red SED of M dwarfs from M1 to M8 observed with the SSO 2.3 m at a spectral resolution of 1.4 Å compared to the best fitting (chi-square minimization) BT-Settl synthetic spectra (red lines). The models displayed have a surface gravity of log g = 5.0 to 5.5. At blue wavelengths (<5000 Å) the instrumental noise dominates the late-type M dwarfs.
Current usage metrics show cumulative count of Article Views (full-text article views including HTML views, PDF and ePub downloads, according to the available data) and Abstracts Views on Vision4Press platform.
Data correspond to usage on the plateform after 2015. The current usage metrics is available 48-96 hours after online publication and is updated daily on week days.
Initial download of the metrics may take a while.