Fig. 2
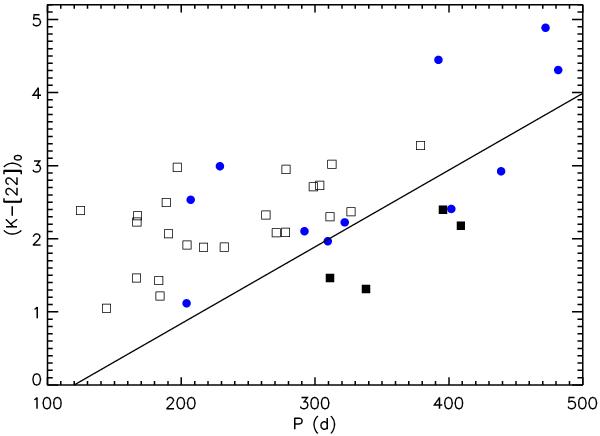
(K − [22] )0 vs. P diagram of Galactic bulge AGB stars. Open and filled squares represent Tc-poor and Tc-rich AGB stars in the outer Galactic bulge from Uttenthaler et al. (2007), whereas filled blue circles represent bulge AGB stars from the sample of Uttenthaler et al. (2013). The solid line was estimated by eye from Fig. 1 to separate Tc-poor from Tc-rich stars.
Current usage metrics show cumulative count of Article Views (full-text article views including HTML views, PDF and ePub downloads, according to the available data) and Abstracts Views on Vision4Press platform.
Data correspond to usage on the plateform after 2015. The current usage metrics is available 48-96 hours after online publication and is updated daily on week days.
Initial download of the metrics may take a while.