Fig. 5
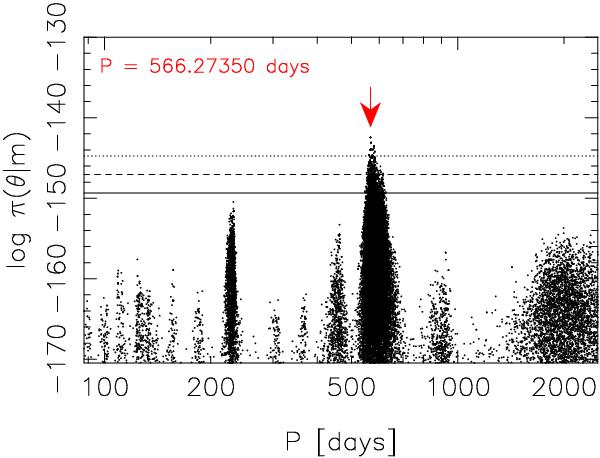
Log-posterior density as a function of the longest periodicity in the GJ 163 data based on temperate sampling. The red arrow indicates the highest value in the sample roughly corresponding to the MAP estimate and the horizontal lines show the probability thresholds 10% (dotted line), 1% (dashed line), and 0.1% (solid line) of the maximum.
Current usage metrics show cumulative count of Article Views (full-text article views including HTML views, PDF and ePub downloads, according to the available data) and Abstracts Views on Vision4Press platform.
Data correspond to usage on the plateform after 2015. The current usage metrics is available 48-96 hours after online publication and is updated daily on week days.
Initial download of the metrics may take a while.