Fig. 1
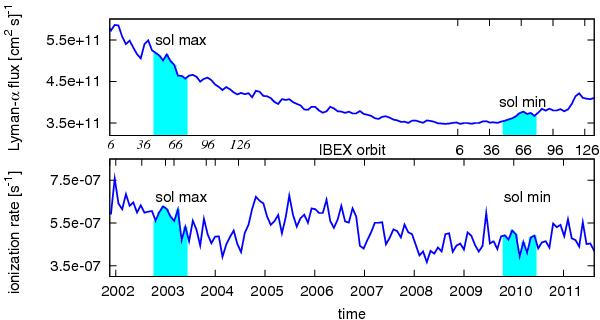
Carrington rotation averaged composite Lyman-α flux (Woods et al. 2000, upper panel) and total ionization rate of D and H (lower panel) since the beginning of the descending phase of solar activity in 2002 until present. The cyan areas mark the solar maximum interval (left) and the solar minimum interval (right) used in the calculations. The placement of IBEX orbits in time relative to the solar activity phase is shown between the panels; italics mark the artificial orbits which are shifted to the beginning of 2002.
Current usage metrics show cumulative count of Article Views (full-text article views including HTML views, PDF and ePub downloads, according to the available data) and Abstracts Views on Vision4Press platform.
Data correspond to usage on the plateform after 2015. The current usage metrics is available 48-96 hours after online publication and is updated daily on week days.
Initial download of the metrics may take a while.