Fig. 9
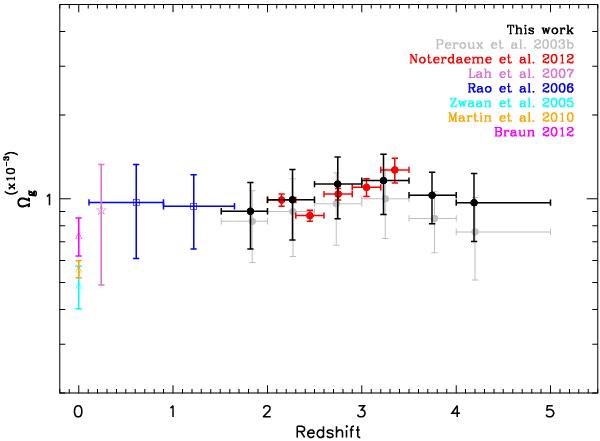
Redshift evolution of the neutral gas mass density, Ωg. The black bins correspond to Ωg measured from DLAs (Péroux et al. 2003b) plus sub-DLAs (combined sub-DLA) contribution. The gray bins show the DLA contribution to the Ωg from Péroux et al. (2003b) in the same redshift bins. The triangles at z = 0 represent the Ωg measured in local galaxies by Zwaan et al. (2005a, cyan), Martin et al. (2010, orange), and Braun (2012, magenta), respectively. The open purple star at z = 0.24 illustrates the H i content measured from the star-forming galaxies by Lah et al. (2007). The blue squares at z < 2 represent the H i measured from Mg ii selected DLAs by Rao et al. (2006). The red bins correspond to the Ωg measured from SDSS by Noterdaeme et al. (2012).
Current usage metrics show cumulative count of Article Views (full-text article views including HTML views, PDF and ePub downloads, according to the available data) and Abstracts Views on Vision4Press platform.
Data correspond to usage on the plateform after 2015. The current usage metrics is available 48-96 hours after online publication and is updated daily on week days.
Initial download of the metrics may take a while.