Fig. 8
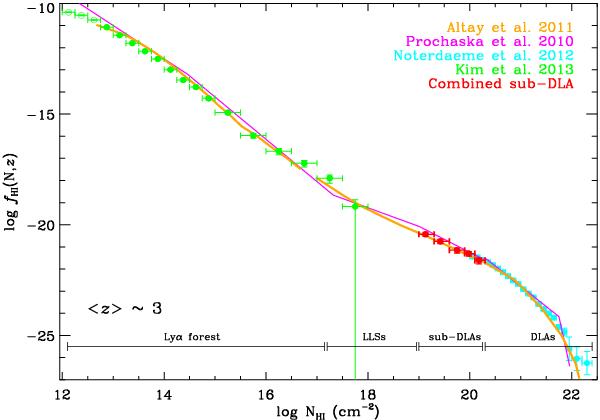
Differential column density distribution (fH I(N,z)) plotted against log NH I. The red data points indicate fH I(N,z) for sub-DLAs from the combined sub-DLA sample. The green filled data points represent fH I(N,z) for Lyα forest from Kim et al. (2013). The green open circles are column densities from Kim et al. (2013) affected by incompleteness. The cyan data points represent the results from Noterdaeme et al. (2012). The solid magenta line is the estimate of fNH I(N,z) at z ~ 3.7 using a series of six power-laws by Prochaska et al. (2010). The solid orange line is hydrodynamic/analytical model prediction at z ~ 3 by Altay et al. (2011).
Current usage metrics show cumulative count of Article Views (full-text article views including HTML views, PDF and ePub downloads, according to the available data) and Abstracts Views on Vision4Press platform.
Data correspond to usage on the plateform after 2015. The current usage metrics is available 48-96 hours after online publication and is updated daily on week days.
Initial download of the metrics may take a while.