Fig. 7
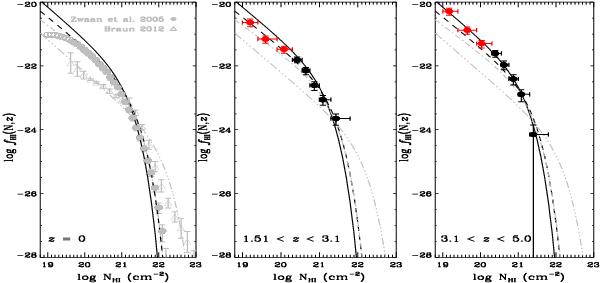
Middle and right panels: differential column density distribution for two redshift ranges. The horizontal error bars are the bin sizes and the vertical error bars represent the Poissonian statistical errors on the column density distribution. The bins in red correspond to the combined sub-DLA sample results and bins in black correspond to the Péroux et al. (2003b) results. The black dashed and solid lines represent the Γ-function fit to the fH I(N,z) in 3.1 <z< 5.0 and 1.51 <z< 3.0 redshift bins, respectively. Left panel: fH I(N,z) at z = 0 from Braun (2012, gray open triangles) and Zwaan et al. (2005b, gray filled circles). Open gray circles correspond to the measurements below the sensitivity limit of Zwaan et al. (2005b). The gray triple dot-dashed and dot-dashed line is Γ-function fit to Braun (2012) and Zwaan et al. (2005b) data, respectively, above their sensitivity limit.
Current usage metrics show cumulative count of Article Views (full-text article views including HTML views, PDF and ePub downloads, according to the available data) and Abstracts Views on Vision4Press platform.
Data correspond to usage on the plateform after 2015. The current usage metrics is available 48-96 hours after online publication and is updated daily on week days.
Initial download of the metrics may take a while.