Fig. 6
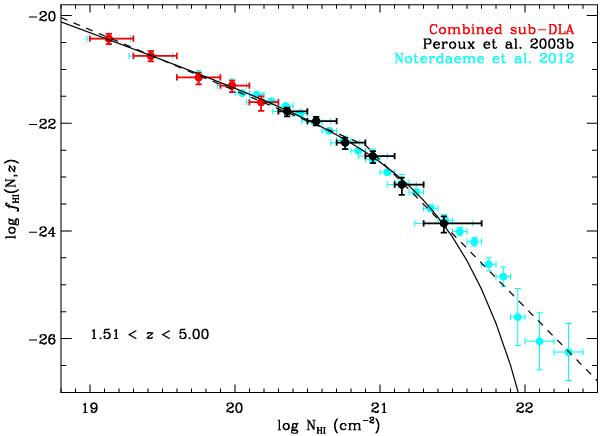
NH I frequency distribution of DLAs (Péroux et al. 2003b) and sub-DLAs (combined sub-DLA sample) in a range of 1.51 <z< 5.00 is shown as black and red circles, respectively. The Γ-function and double power-law fit to these DLA and sub-DLA results are shown as solid and dashed black lines, respectively. The cyan data points represent the results from Noterdaeme et al. (2012) over two orders of magnitude in NH I. The departure at high column densities (log NH I> 21.0) from the Γ-function shape is due to low number statistics at higher column density in the former studies.
Current usage metrics show cumulative count of Article Views (full-text article views including HTML views, PDF and ePub downloads, according to the available data) and Abstracts Views on Vision4Press platform.
Data correspond to usage on the plateform after 2015. The current usage metrics is available 48-96 hours after online publication and is updated daily on week days.
Initial download of the metrics may take a while.