Fig. 4
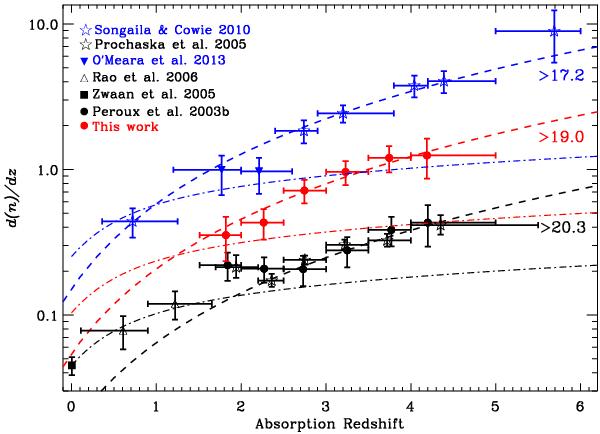
Number density (d(n)/dz) of quasar absorbers as a function of redshift. d(n)/dz for DLAs: Péroux et al. (2003b, black circles), Prochaska et al. (2005, black open stars), Rao et al. (2006, black open triangles), and Zwaan et al. (2005b, black square) are shown. d(n)/dz for sub-DLAs: the combined sub-DLA sample (red circles), and LLSs: Songaila & Cowie (2010, blue open stars) and O’Meara et al. (2013, blue inverted triangles) are shown. The size of the horizontal bars represents the redshift bin sizes, and the vertical error bars are the 1σ Poisson uncertainties in the number of absorbers. The blue dashed line is the simple evolution fit to the LLS from Songaila & Cowie (2010). The red and black dashed lines are the LLS evolution fit scaled by a factor of 2.8 and 9.0 for the difference in d(n)/dz of sub-DLAs and DLAs with respect to LLSs (in the range 2.5 < z < 3.0), respectively. The black dot-dashed curve represents a non-evolving population of non-zero Λ-Universe. The red and blue dot-dashed curves are non-evolution curves scaled to a factor of 2.3 and 5.6, respectively (see text for more detail).
Current usage metrics show cumulative count of Article Views (full-text article views including HTML views, PDF and ePub downloads, according to the available data) and Abstracts Views on Vision4Press platform.
Data correspond to usage on the plateform after 2015. The current usage metrics is available 48-96 hours after online publication and is updated daily on week days.
Initial download of the metrics may take a while.