Fig. 3
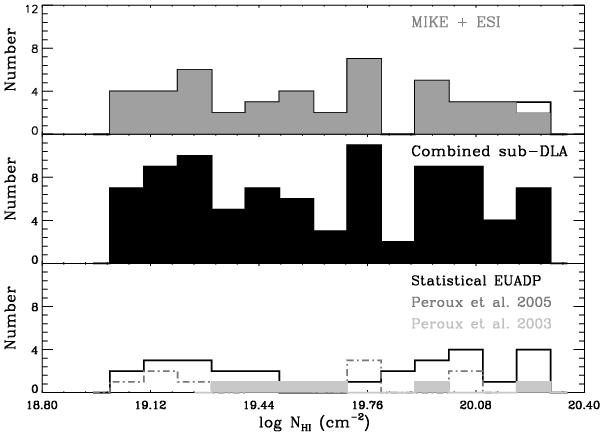
Histograms showing the number of sub-DLAs as a function of log NH I. Top panel: MIKE + ESI sample from O’Meara et al. (2007). The filled area represents the new sub-DLAs in MIKE + ESI sample and the unfilled area illustrates the ones overlapping with the combined sub-DLA sample. Middle panel: combined sub-DLA sample. Bottom panel: the solid black, dash-dotted gray and filled gray histograms show the contribution of sub-DLAs to the combined sub-DLA sample from the statistical EUADP, Péroux et al. (2005), and Péroux et al. (2003a) samples respectively.
Current usage metrics show cumulative count of Article Views (full-text article views including HTML views, PDF and ePub downloads, according to the available data) and Abstracts Views on Vision4Press platform.
Data correspond to usage on the plateform after 2015. The current usage metrics is available 48-96 hours after online publication and is updated daily on week days.
Initial download of the metrics may take a while.