Fig. 10
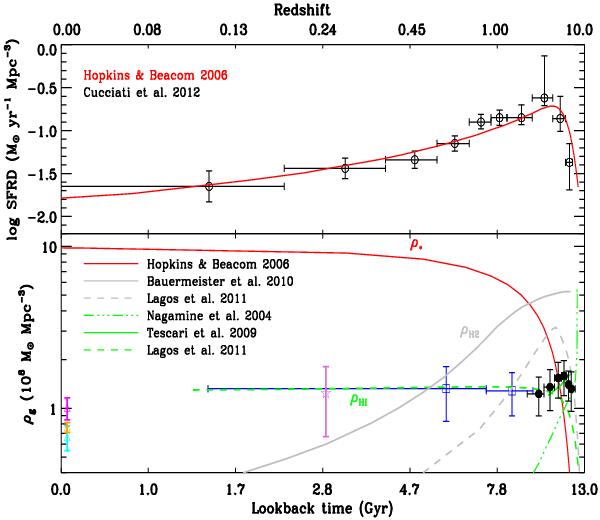
Top panel: total dust-corrected UV-derived SFR density as a function of lookback time from the visible multi object-spectrograph (VIMOS)-VLT deep survey (VVDS) Deep + Ultra-Deep sample from Cucciati et al. (2012) is illustrated as black open circles. The red curve corresponds to the best-fitting parametric form to the SFR density from Hopkins & Beacom (2006). Bottom panel: the data points have the same meaning as in Fig. 9. The green curves represent the prediction of ρH I from Nagamine et al. (2004, green triple dot-dashed line), Tescari et al. (2009, green solid line), and Lagos et al. (2011, green dashed line). The gray curves correspond to the prediction of ρH2 from Bauermeister et al. (2010, solid gray line) and Lagos et al. (2011, gray dashed line). The solid red line illustrates the evolution of the stellar mass density build-up inferred from the star formation history by Hopkins & Beacom (2006).
Current usage metrics show cumulative count of Article Views (full-text article views including HTML views, PDF and ePub downloads, according to the available data) and Abstracts Views on Vision4Press platform.
Data correspond to usage on the plateform after 2015. The current usage metrics is available 48-96 hours after online publication and is updated daily on week days.
Initial download of the metrics may take a while.