Free Access
Fig. 24
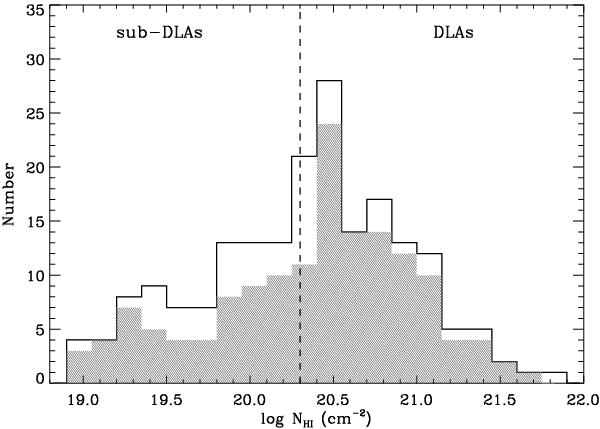
Histogram showing the number of DLAs and sub-DLAs along lines-of-sight to the quasars in the EUADP sample. The shaded area represents the column density distribution of damped absorbers for which the Lyα line is covered by the EUADP data. The vertical dashed line is the dividing line between the sub-DLAs and DLAs classes.
Current usage metrics show cumulative count of Article Views (full-text article views including HTML views, PDF and ePub downloads, according to the available data) and Abstracts Views on Vision4Press platform.
Data correspond to usage on the plateform after 2015. The current usage metrics is available 48-96 hours after online publication and is updated daily on week days.
Initial download of the metrics may take a while.