Fig. 20
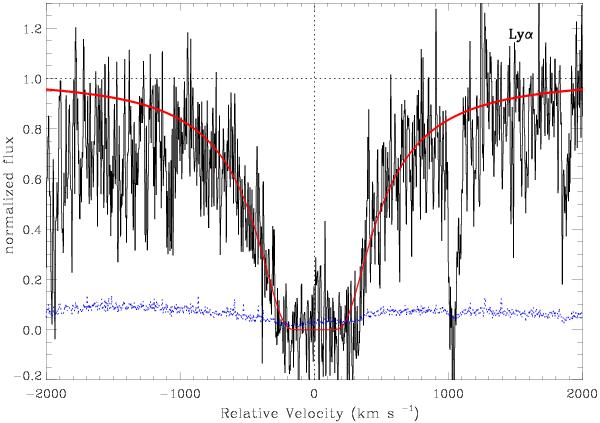
Sub-DLA detected towards J223941.8-294955 at zabs = 1.825. The spectrum is smoothed with a boxcar average of 1.0 pixel for plotting reasons. The solid red line corresponds to the Voigt profile fit to the sub-DLA with an inferred column density of log NH I = 19.84 ± 0.14. Emission is clearly seen in the trough of this absorber which is likely to correspond to the Lyman-α emission from the sub-DLA host.
Current usage metrics show cumulative count of Article Views (full-text article views including HTML views, PDF and ePub downloads, according to the available data) and Abstracts Views on Vision4Press platform.
Data correspond to usage on the plateform after 2015. The current usage metrics is available 48-96 hours after online publication and is updated daily on week days.
Initial download of the metrics may take a while.