Fig. 2
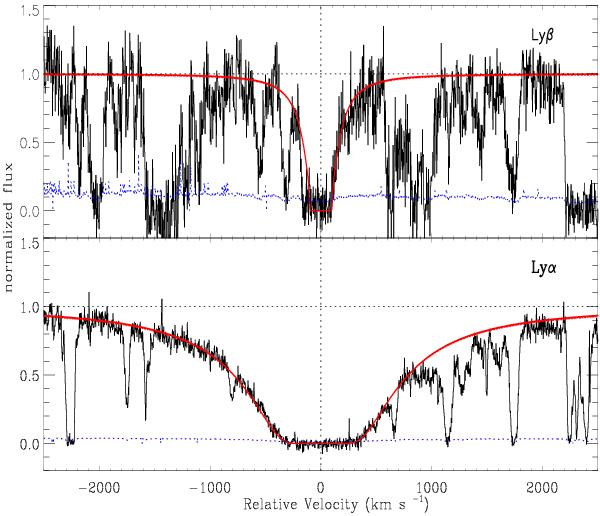
Sub-DLA detected towards QSO J0008-2900 at zabs = 2.254. The solid red line shows the Voigt profile fit to the sub-DLA with an inferred column density of log NH I = 20.22 ± 0.10. The system is detected down to Lyβ. Here and in the following figures, the dotted blue line represents 1σ error on the spectrum. The vertical dotted line is the adopted zero velocity corresponding to the redshift of the sub-DLA. The horizontal line is at a level of one.
Current usage metrics show cumulative count of Article Views (full-text article views including HTML views, PDF and ePub downloads, according to the available data) and Abstracts Views on Vision4Press platform.
Data correspond to usage on the plateform after 2015. The current usage metrics is available 48-96 hours after online publication and is updated daily on week days.
Initial download of the metrics may take a while.