Free Access
Fig. 13
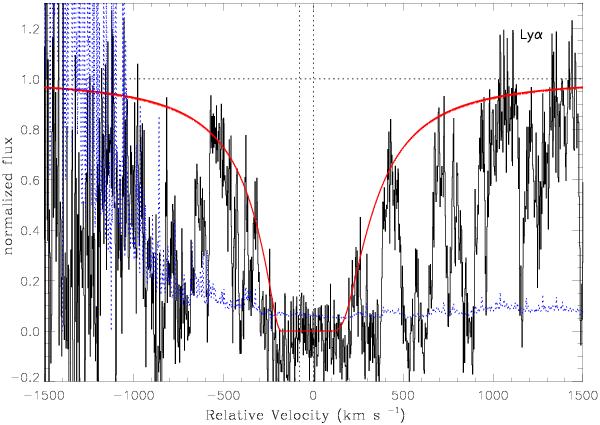
Sub-DLA detected towards LBQS 1232 + 0815 at zabs = 1.720. The spectrum is smoothed with a boxcar average of 0.5 pixel for plotting purposes. The solid red line represents the Voigt profile fit to the sub-DLA with a total column density of log NH I = 19.48 ± 0.13 using 0 and − 78 km s-1 velocity components (see Fig. 14).
Current usage metrics show cumulative count of Article Views (full-text article views including HTML views, PDF and ePub downloads, according to the available data) and Abstracts Views on Vision4Press platform.
Data correspond to usage on the plateform after 2015. The current usage metrics is available 48-96 hours after online publication and is updated daily on week days.
Initial download of the metrics may take a while.