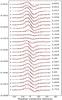
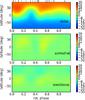
Fig. 3
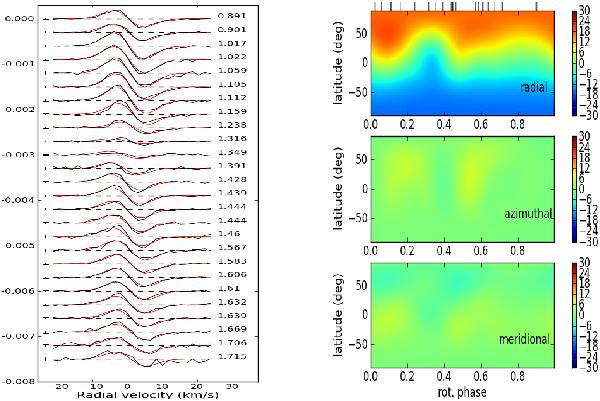
β Ceti in the period June 2010–December 2010. Left panel: normalized Stokes V profiles – observed profiles (black lines); synthetic profiles (red lines); zero level (dashed lines). All profiles are shifted vertically for display purposes. The rotational phases of observations are indicated in the right part of the plot and the error bars are on the left of each profile. Right panel: Magnetic map of β Ceti. The three panels illustrate the field components in spherical coordinates (from top to bottom – radial, azimuthal, meridional). The magnetic field strength is expressed in Gauss. The vertical ticks on top of the radial map show the phases of observations.
Current usage metrics show cumulative count of Article Views (full-text article views including HTML views, PDF and ePub downloads, according to the available data) and Abstracts Views on Vision4Press platform.
Data correspond to usage on the plateform after 2015. The current usage metrics is available 48-96 hours after online publication and is updated daily on week days.
Initial download of the metrics may take a while.