Fig. 4
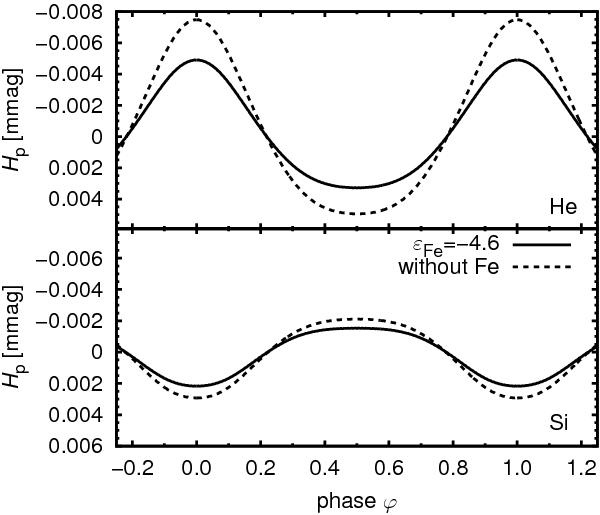
Predicted light variations of HD 64740 in Hp photometric filter calculated using abundance maps of one element only. The abundance of other elements was fixed. Upper plot: light variations due to helium only. Silicon abundance was fixed to εSi = − 4.3. Lower plot: light variations due to silicon only. The helium abundance was fixed to εHe = − 1.0. Light curves were calculated using the solar iron abundance (εFe = − 4.6, solid lines) and without iron (dashed lines).
Current usage metrics show cumulative count of Article Views (full-text article views including HTML views, PDF and ePub downloads, according to the available data) and Abstracts Views on Vision4Press platform.
Data correspond to usage on the plateform after 2015. The current usage metrics is available 48-96 hours after online publication and is updated daily on week days.
Initial download of the metrics may take a while.