Free Access
Fig. 12
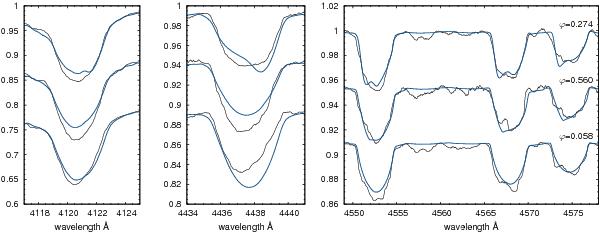
Line profiles of individual helium and silicon lines in different phases (observed with FEROS) compared with line profiles predicted using abundance maps. Line profiles were vertically shifted to better demonstrate the line variability. Left and middle: Helium lines. Right: Silicon lines.
Current usage metrics show cumulative count of Article Views (full-text article views including HTML views, PDF and ePub downloads, according to the available data) and Abstracts Views on Vision4Press platform.
Data correspond to usage on the plateform after 2015. The current usage metrics is available 48-96 hours after online publication and is updated daily on week days.
Initial download of the metrics may take a while.