Fig. 11
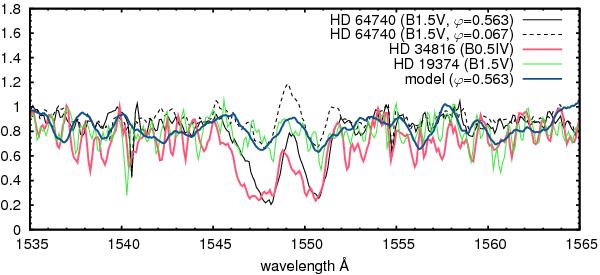
Comparison of C iv resonance line profiles. The observed line profiles of HD 64740 are plotted in the phases of maximum and minimum line strengths. The predicted line profile was calculated assuming a homogeneous carbon abundance distribution, consequently it shows basically no variations. These line profiles are compared with IUE line profiles of normal stars with slightly earlier and the same spectral types than that of HD 64740. We note that the fluxes were normalized to a pseudo-continuum given by numerous absorption lines.
Current usage metrics show cumulative count of Article Views (full-text article views including HTML views, PDF and ePub downloads, according to the available data) and Abstracts Views on Vision4Press platform.
Data correspond to usage on the plateform after 2015. The current usage metrics is available 48-96 hours after online publication and is updated daily on week days.
Initial download of the metrics may take a while.